Chapter 4 Missing values
For simplicity of the analysis, we extracted abnormal data (missing data, outliers) using SQL and gathered the result into 2 csv files, abnormal_data.csv and abnormal_location.csv. To explore the missing value patterns, we only need abnormal_data.csv.
4.1 Missing values by Column and Row
##        start.station.id      start.station.name          end.station.id
##                    2677                    2677                    2677
##        end.station.name            tripduration               starttime
##                    2677                       0                       0
##                stoptime  start.station.latitude start.station.longitude
##                       0                       0                       0
##    end.station.latitude   end.station.longitude                  bikeid
##                       0                       0                       0
##                usertype              birth.year                  gender
##                       0                       0                       0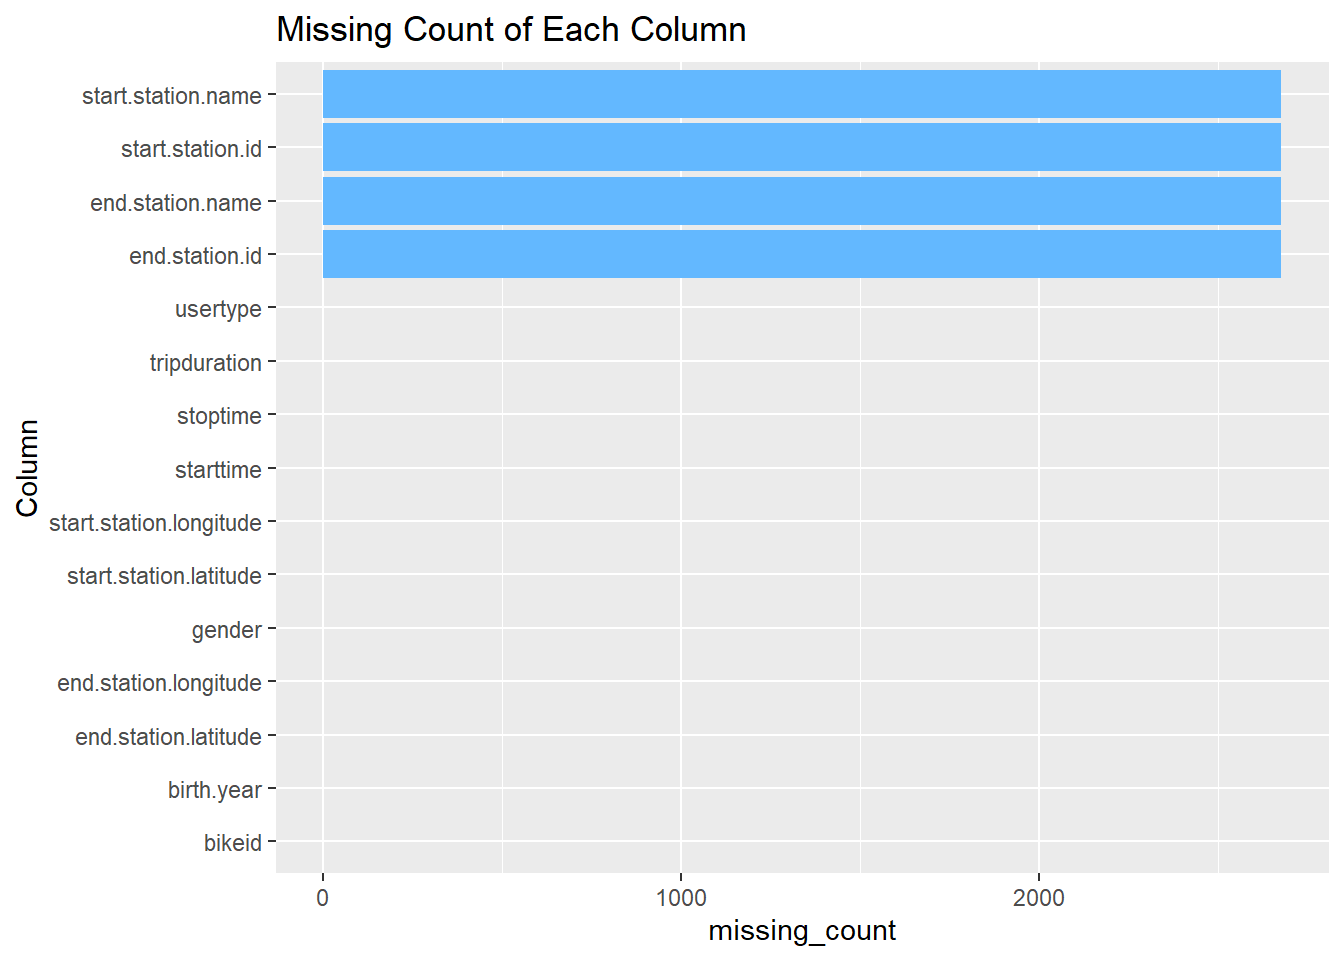
We can see that all missing entries are in 4 columns, the start station’s name, id, and the end station’s name id. The 4 columns have the same missing value count of 2677. In fact, it can be observed that if a row contains a missing value, all 4 columns (start station name, start station id, end station name, end station id) will contain missing values.
##   missing_count row_count
## 1             0     48559
## 2             4      2677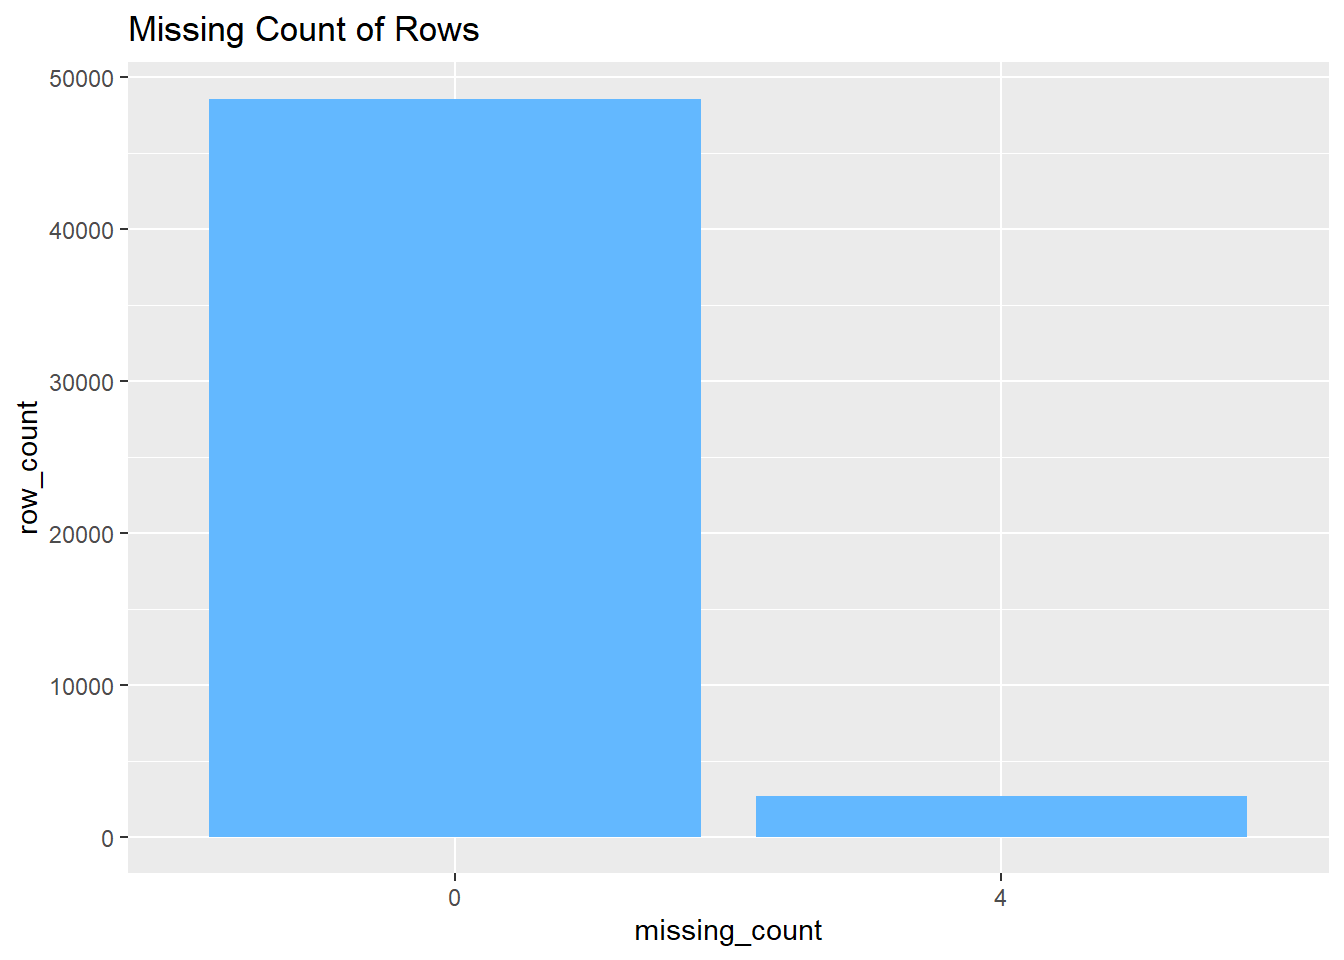
We can see that there are 2677 rows that contain 4 missing entries, and other rows don’t have any missing entries. This verifies that if a row contains a missing value, all 4 columns (start station name, start station id, end station name, end station id) will be missing.
4.2 Missing pattern by Year and Month
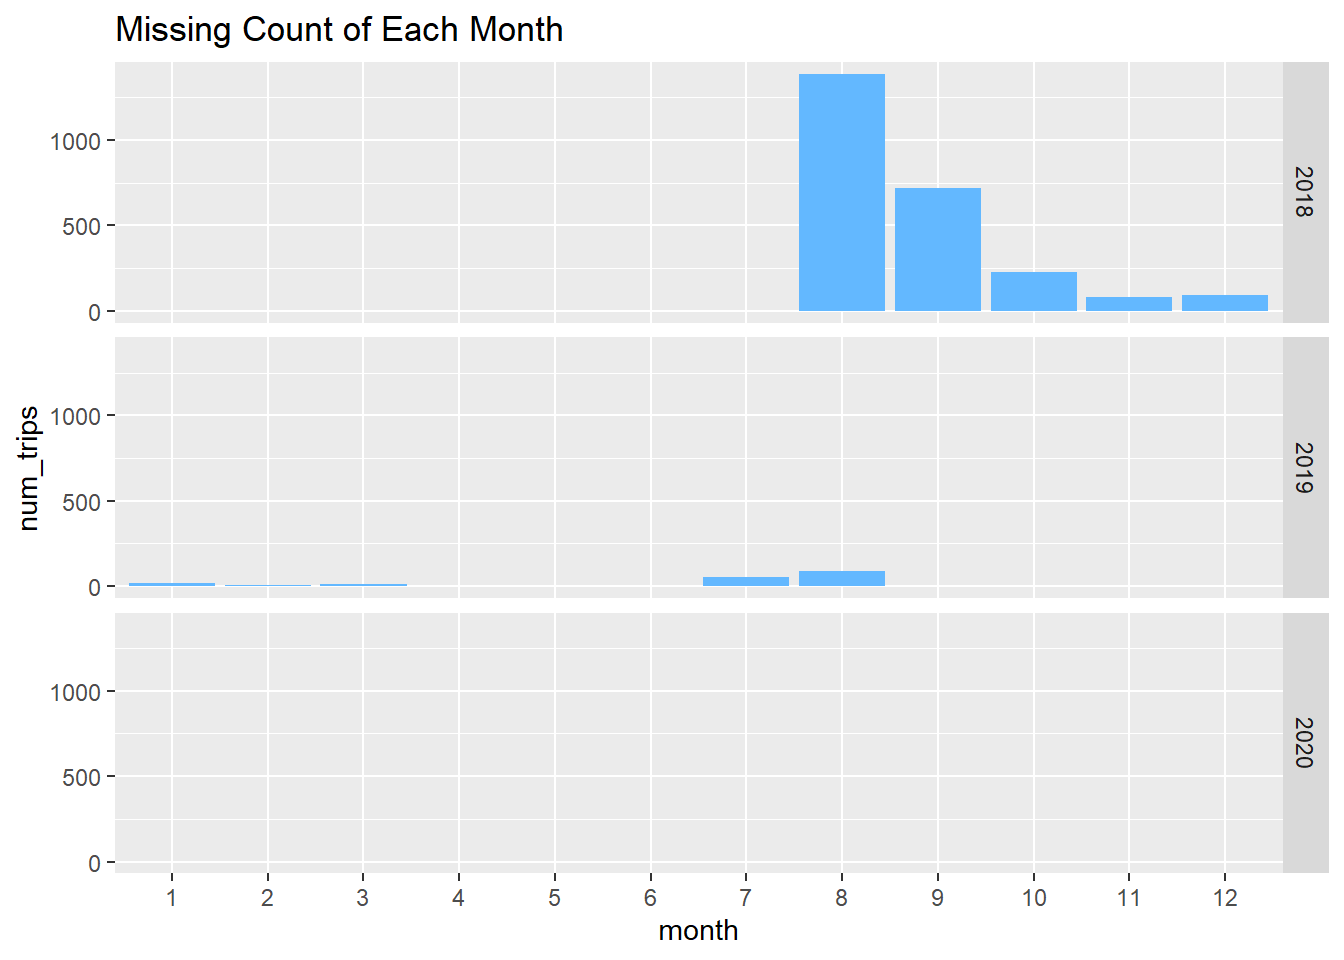
The plot above shows that there are many missing entries in 2018, especially 2018-08, with more than 1000 rows that have missing values. There are only a few missing rows in 2019, and there are no missing rows in 2020.
4.3 Dealing with missing values
We decided that we discard all these rows that contain missing values and outliers before we conduct any further analysis.
It should be noted that there are only 2677 rows that contains missing values. If we include rows that have outliers, we only need to discard about 50000 rows. Comparing to the overall data size of about 55 million rows, we are only throwing away a small portion, which will not largely impact our analysis.